Shanghai Rankings 2018: Same old top 10, Australia improves
Study International Staff
17 Aug 2018
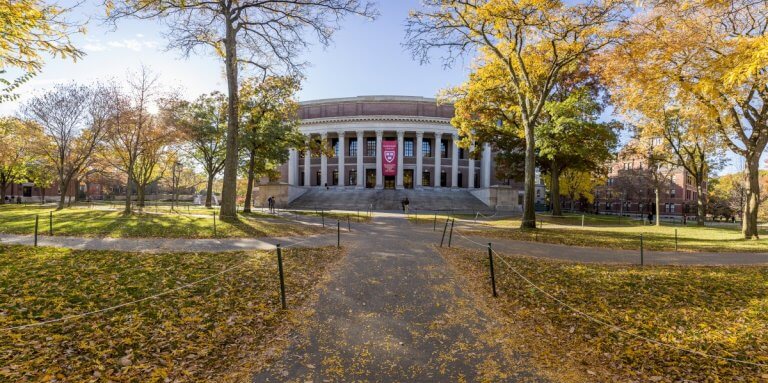


The 2018 Academic Ranking of World Universities (ARWU) – known as the Shanghai Rankings – was published yesterday, and Harvard continues to be the global number one for the 16th consecutive year.
Other institutions in the Top 10 remain unchanged. Similarly, those in positions 11-20 last year either moved up or down the ranks by two positions maximum.
Here’s a list of the Top 20 institutions this year:
| Rank 2018 | Rank 2017 | Institution | Country |
|---|---|---|---|
| 1 | 1 |
Harvard University
|
United States |
| 2 | 2 |
Stanford University
|
United States |
| 3 | 3 |
University of Cambridge
|
United Kingdom |
| 4 | 4 |
Massachusetts Institute of Technology (MIT)
|
United States |
| 5 | 5 |
University of California, Berkeley
|
United States |
| 6 | 6 |
Princeton University
|
United States |
| 7 | 7 |
University of Oxford
|
United Kingdom |
| 8 | 8 |
Columbia University
|
United States |
| 9 | 9 |
California Institute of Technology
|
United States |
| 10 | 10 |
University of Chicago
|
United States |
| 11 | 12 |
University of California, Los Angeles
|
United States |
| 12 | 14 |
Cornell University
|
United States |
| 12 | 11 |
Yale University
|
United States |
| 14 | 13 |
University of Washington
|
United States |
| 15 | 15 |
University of California, San Diego
|
United States |
| 16 | 17 |
University of Pennsylvania
|
United States |
| 17 | 16 |
University College London
|
United Kingdom |
| 18 | 18 |
Johns Hopkins University
|
United States |
| 19 | 19 |
Swiss Federal Institute of Technology Zurich
|
Switzerland |
| 20 | 20 |
Washington University in St. Louis
|
United States |
More changes emerge further down the ranks.
Improvements are plenty among Australian institutions: the University of Melbourne is one notch up from last year’s position, leading the country at 38th spot.
The Australian National University is now at 69th position, up significantly from 97th last year. Meanwhile, the Univesity of Sydney sees its position move from 15 spots to 68th this year.
The Australian Financial Review (AFR) notes that the number of Australian universities in the Shanghai Rankings top 100 has doubled from just three back in 2003, when the rankings were first published.
The country’s advance in the rankings this year comes in the wake of a report that Australia has surpassed the UK as the second favourite study abroad destination, despite the latter having held the position comfortably for many years.
Earlier this week, another report by London Economics, found that the Group of Eight universities contributed AU$66.4 billion to the country’s economy in short and long-term benefits in 2016.
Hats off 🎓🎓 to the 6 #Aussie #universities who’ve ranked in the #top100 in the world’s best university rankings. 🇦🇺👏 Shout out to @unimelb making the #top50 (placing 38th), and @Sydney_Uni who has jumped 15 places to 68th. See the full rankings: https://t.co/QnNJeBd7Wz pic.twitter.com/BerTTIZU77
— Australia in the US (@AusintheUS) August 15, 2018
Speaking to AFR, Higher Education Program Director at the Grattan Institute, Andrew Norton, said it was a strong performance from Australia in what’s widely regarded as one of the best global rankings.
“Shanghai has a single focus on research rather than combining multiple surveys. It shows that research in Australia has been pretty strong, has transformed itself over 25-year period,” he said.
“Research is very globalised and we are well integrated into global research.”
The London Economics report showed that the Go8 universities alone secured a total of AU$2.44 billion in research-related income in 2016, for which almost half (45 percent) was received through Australian competitive grants, the majority of which ($0.99bn) was provided by Commonwealth departments and agencies.
At the same time, university-financed research has also increased when compared to figures from more than a decade ago.
| Criteria | Indicator | Code | Weight | |
|---|---|---|---|---|
| Quality of Education | Alumni of an institution winning Nobel Prizes and Fields Medals | Alumni | 10% | |
| Quality of Faculty | Staff of an institution winning Nobel Prizes and Fields Medals | Award | 20% | |
| Highly cited researchers in 21 broad subject categories | HiCi | 20% | ||
| Research Output | Papers published in Nature and Science (N&S)* | N&S | 20% | |
| Papers indexed in Science Citation Index-expanded and Social Science Citation Index | PUB | 20% | ||
| Per Capita Performance | Per capita academic performance of an institution | PCP | 10% | |
| Total | 100% | |||
| * For institutions specialized in humanities and social sciences such as London School of Economics, N&S is not considered, and the weight of N&S is relocated to other indicators. | ||||
While these indicators are often praised as objective and stable, one downside to the focus on research is that the rankings do not account for university size. A bigger university will always end up with more publications and award winners, regardless of research (or teaching) quality.
What to expect from the QS Top 50 Under 50 Rankings 2019
Rankings Explained: The top 4 global university rankings every student should know